BASIC CONCEPT: MEDIUM OXYGEN DEPLETION (MOD)
Petaka G3 LOT in an open environment, with 21% oxygen, works like a hypoxia chamber with an atmosphere of 2% oxygen; Petaka G3 will dissipate the oxygen dissolved in the media like a flask or dish will do inside an incubator with 2% oxygen.
Petaka G3 has a proportional valve system (PVS) controlling the in/out gas diffusion, and a diffusion restriction system (DRS). If the partial pressure of a gas in the media is lower than in the atmosphere, the PVS allows the diffusion of gas in the media until both partial pressures are balanced, and vice versa.
The diffusion restriction system (DRS) imposes a particular and predetermined intake diffusion rate (PDR) in each Petaka G3 type. The DRS quenches heavily the gas diffusion in both directions, allowing the progressive gas depletion or slow repletion. In effect, if the cell population consumes more oxygen than the PDR, the cells progressively deplete the dissolved oxygen until the minimal biologic oxygen consumption rate (mbOCR) of the cell population equals the PDR, then the inner and external oxygen in and out diffusion will be intermittently balance and the media will exhibit a flat pulsing level of dissolved oxygen. That level will be characteristic of the cell type and the functional conditions of the cells.

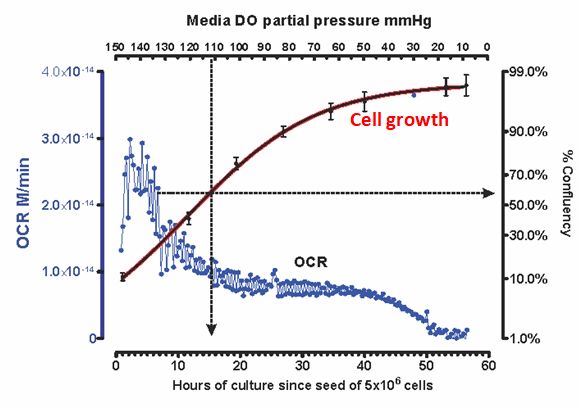
Figure 1.-Progressive reduction of the OCR vs DO concentration and cell growth
Petaka G3 DO-Sensor is the only device able to provide information on the oxygen consumption rate (OCR) of cells exposed to a continuous gradient of decreasing oxygen concentrations, from 150 mmHg to 10 mmHg. This performance allowed the discovery that the OCR of cells is not constant, rather adapts to the environmental concentration of oxygen (Fig.1).
OCR data obtained in cultures grown in flasks or dishes, at open 21% oxygen, OCR values will be erroneous by excess (more than double of the values done under real oxygen tension occurring in the living tissues).
Can be assured that normal OCR occurs below 110 mmHg, equivalent to an atmospheric 15% oxygen. Actually, atmospheric hypoxia between 14% and 6% oxygen show the most stable OCR in majority of the investigated cell types; within a 40 mmHg and 90 mmHg bracket, which incorporates the most common oxygen tensions in natural tissues.
Specifically HeLa cells, as an example, reduce the OCR enormously when DO is below 30 mmHg (below 4% atmospheric concentration of Oxygen), depicting the progressive switch from OXPHOX to anaerobic glycolysis. In Petaka G3, that deep hypoxia level is achieved when cell growth reaches the final plateau, almost 94% confluent.

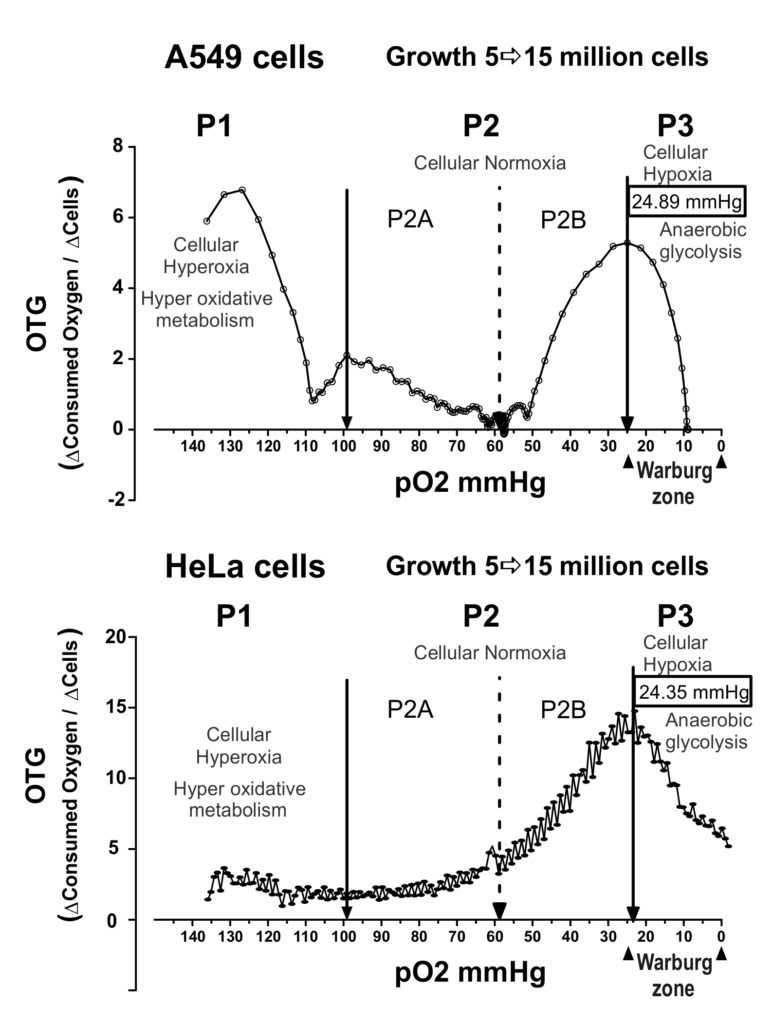
Fig. 2.- Diferences in OTG of lung cancer cells and cervical cancer cells. However the WSP is close to 25 mmHg in all of them.
CONCEPT: OXYGEN TOLL OF GROWTH (OTG)
In a growing cell population, the “Oxygen toll of growth” (OTG) is a dynamic concept; it shows the ratio between the oxygen consumed and the increase of cells per each time step of the cell culture progression:
Lapses with high growth and low OCR, yield low OTG values, and vice versa, low growth rate and high OCR yield high OTG values.
This concept discloses several characteristics of the oxygen burning up by cells, for example, how cells modify the OCR under different oxygen concentrations in the media. Fast growing cells increase the oxygen consumption, decreasing the DO concentration in the environment; When DO is about 1.5 mg/L (40 mmHg) cells reduce the growth rate, but hold the OCR showing a rapid increase of the OTG, until an inflection point after which the cells grow very slowly and the OTG drops in values close to zero (see figure 2).
CONCEPT: WARBURG SHIFT POINT (WSP)
Fast growing cells increase the oxygen consumption, lessening the DO concentration in the environment; When DO is about 1.5 mg/L (40 mmHg) cells reduce the growth rate (Fig.3 red curve), but hold the OCR showing a rapid increase of the OTG (Fig. 3 purple line), until reaches a utmost. Then, OCR is progressively reduced while cell growth is low, but maintained, imposing a rapid decay of the OTG. That is due to the shift from OXPHOS to anaerobic glycolysis, which force a fast decrease the oxygen consumption. The utmost value of OTG points the gate to the Warburg shift of energy source in cells (WSP).
